Local Host Daily
24 Hour Film/Installation
2023
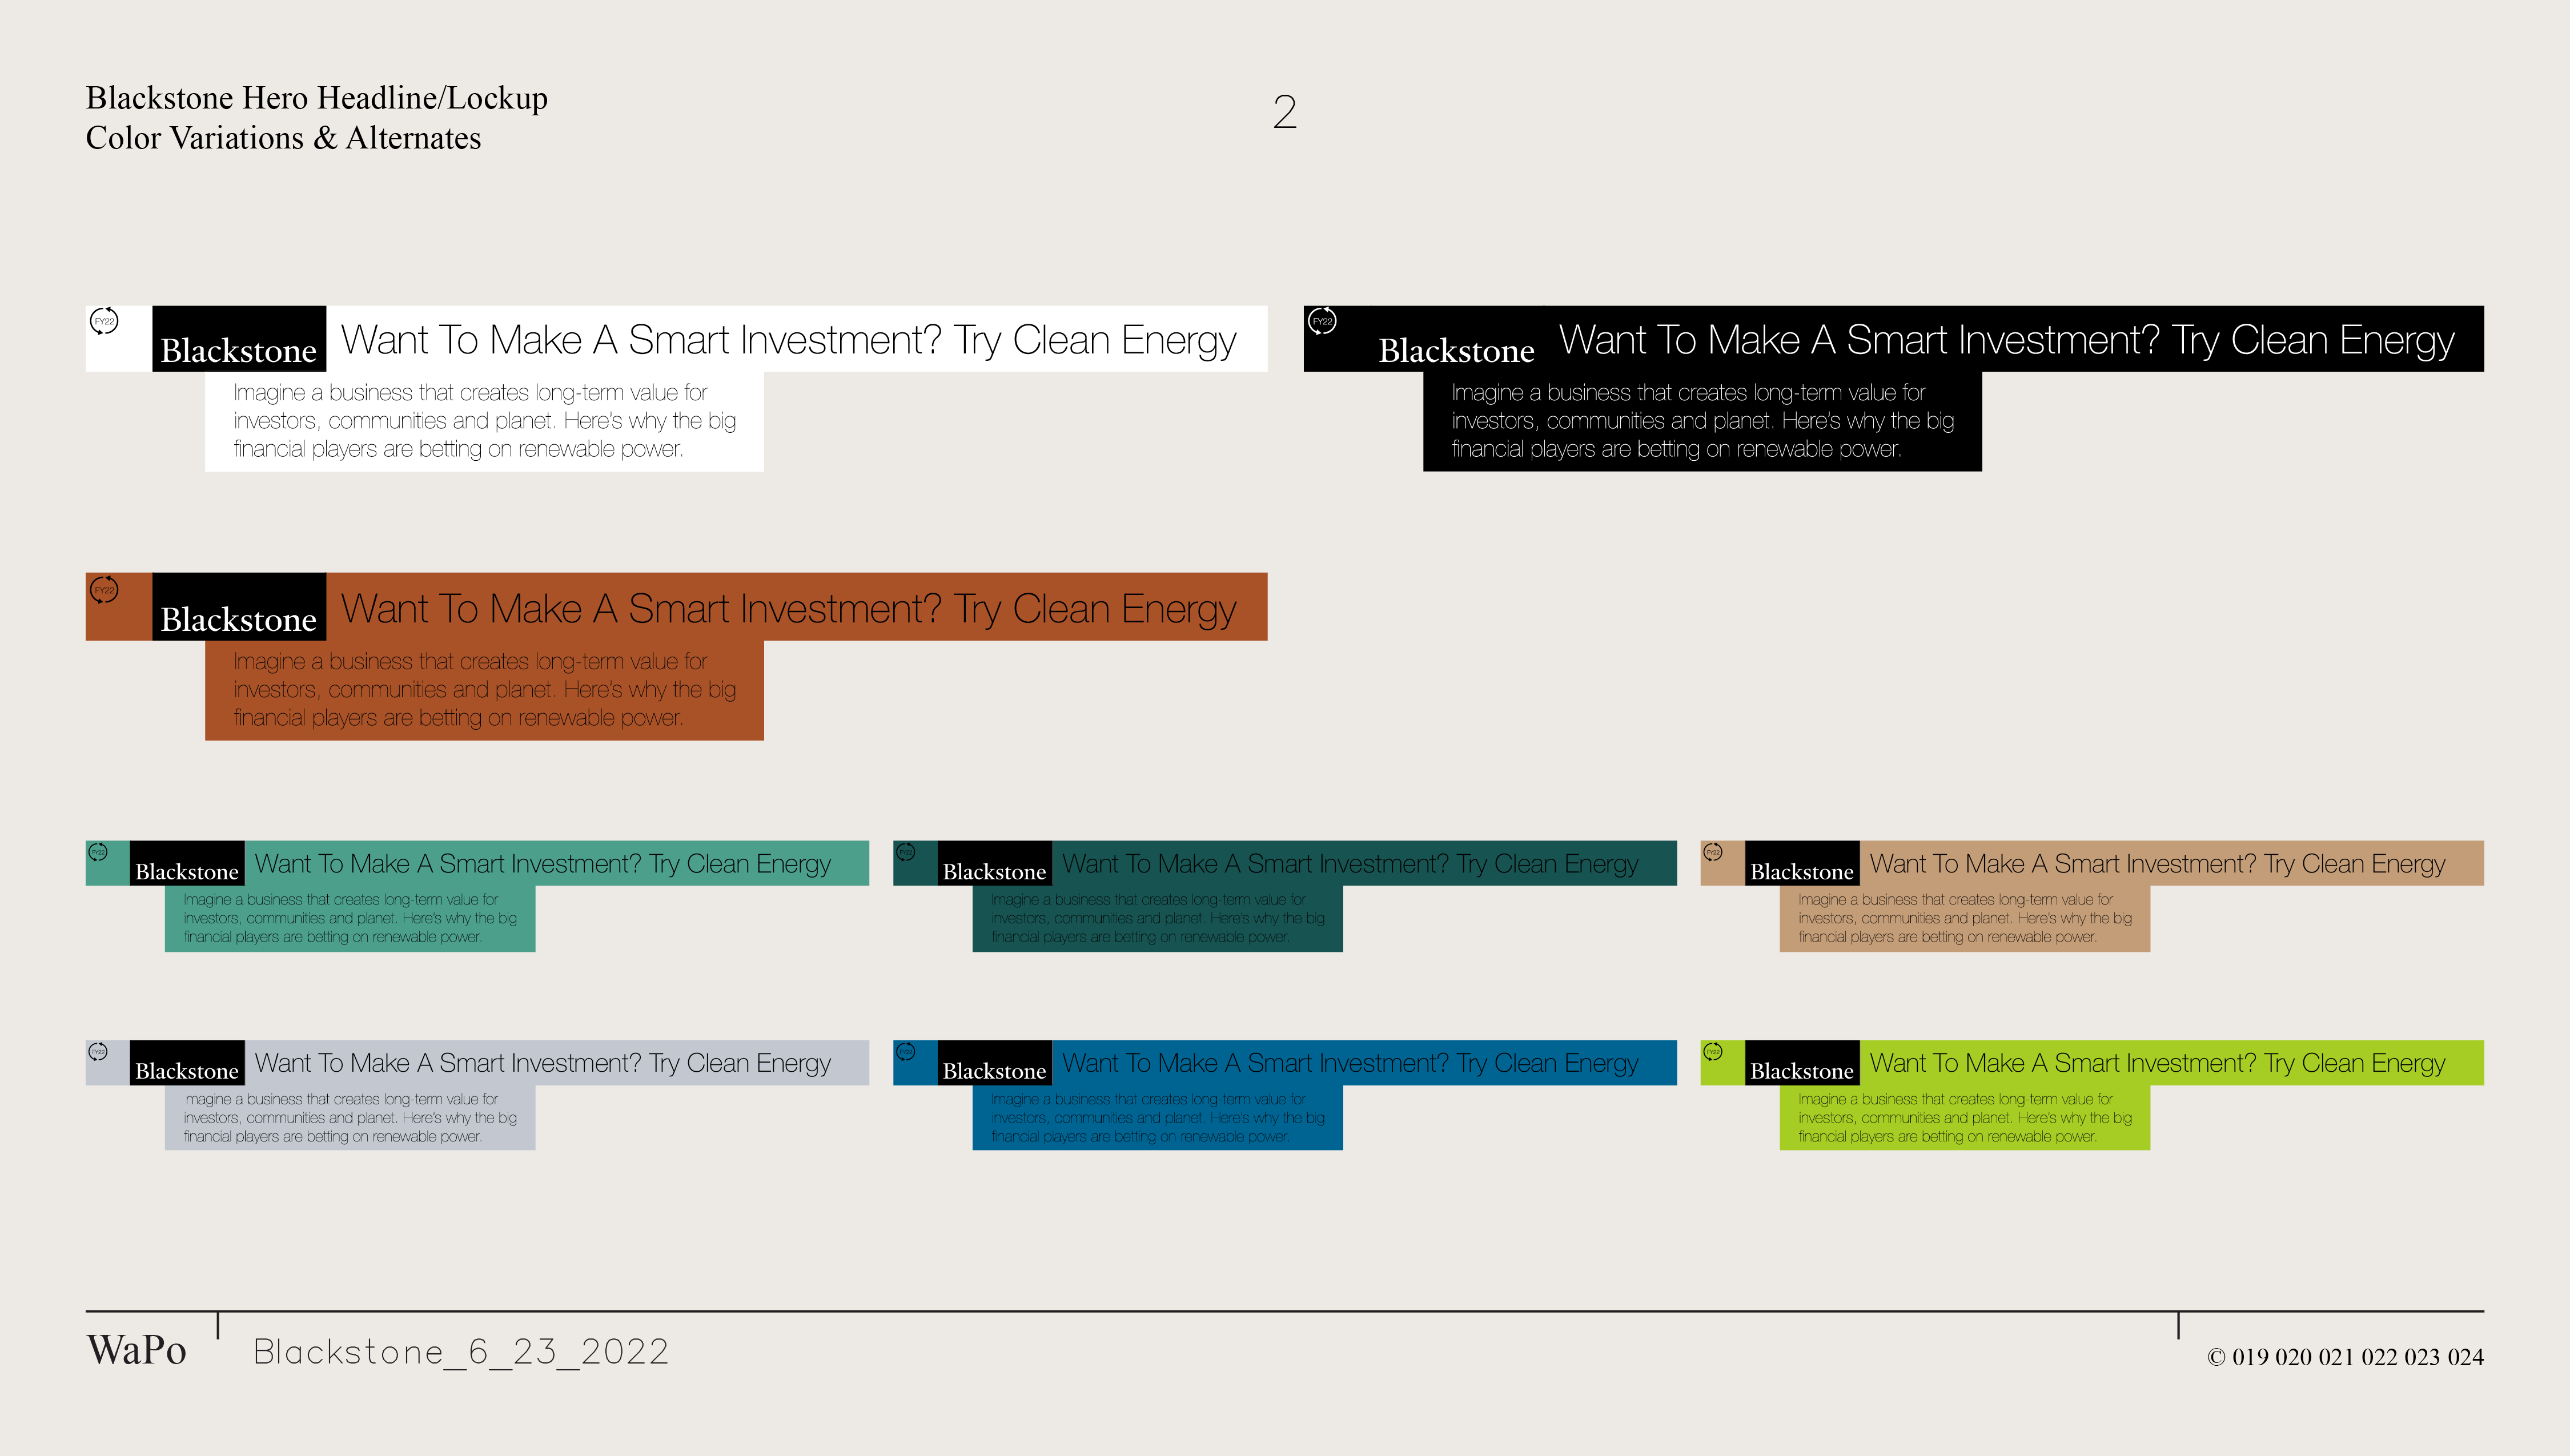
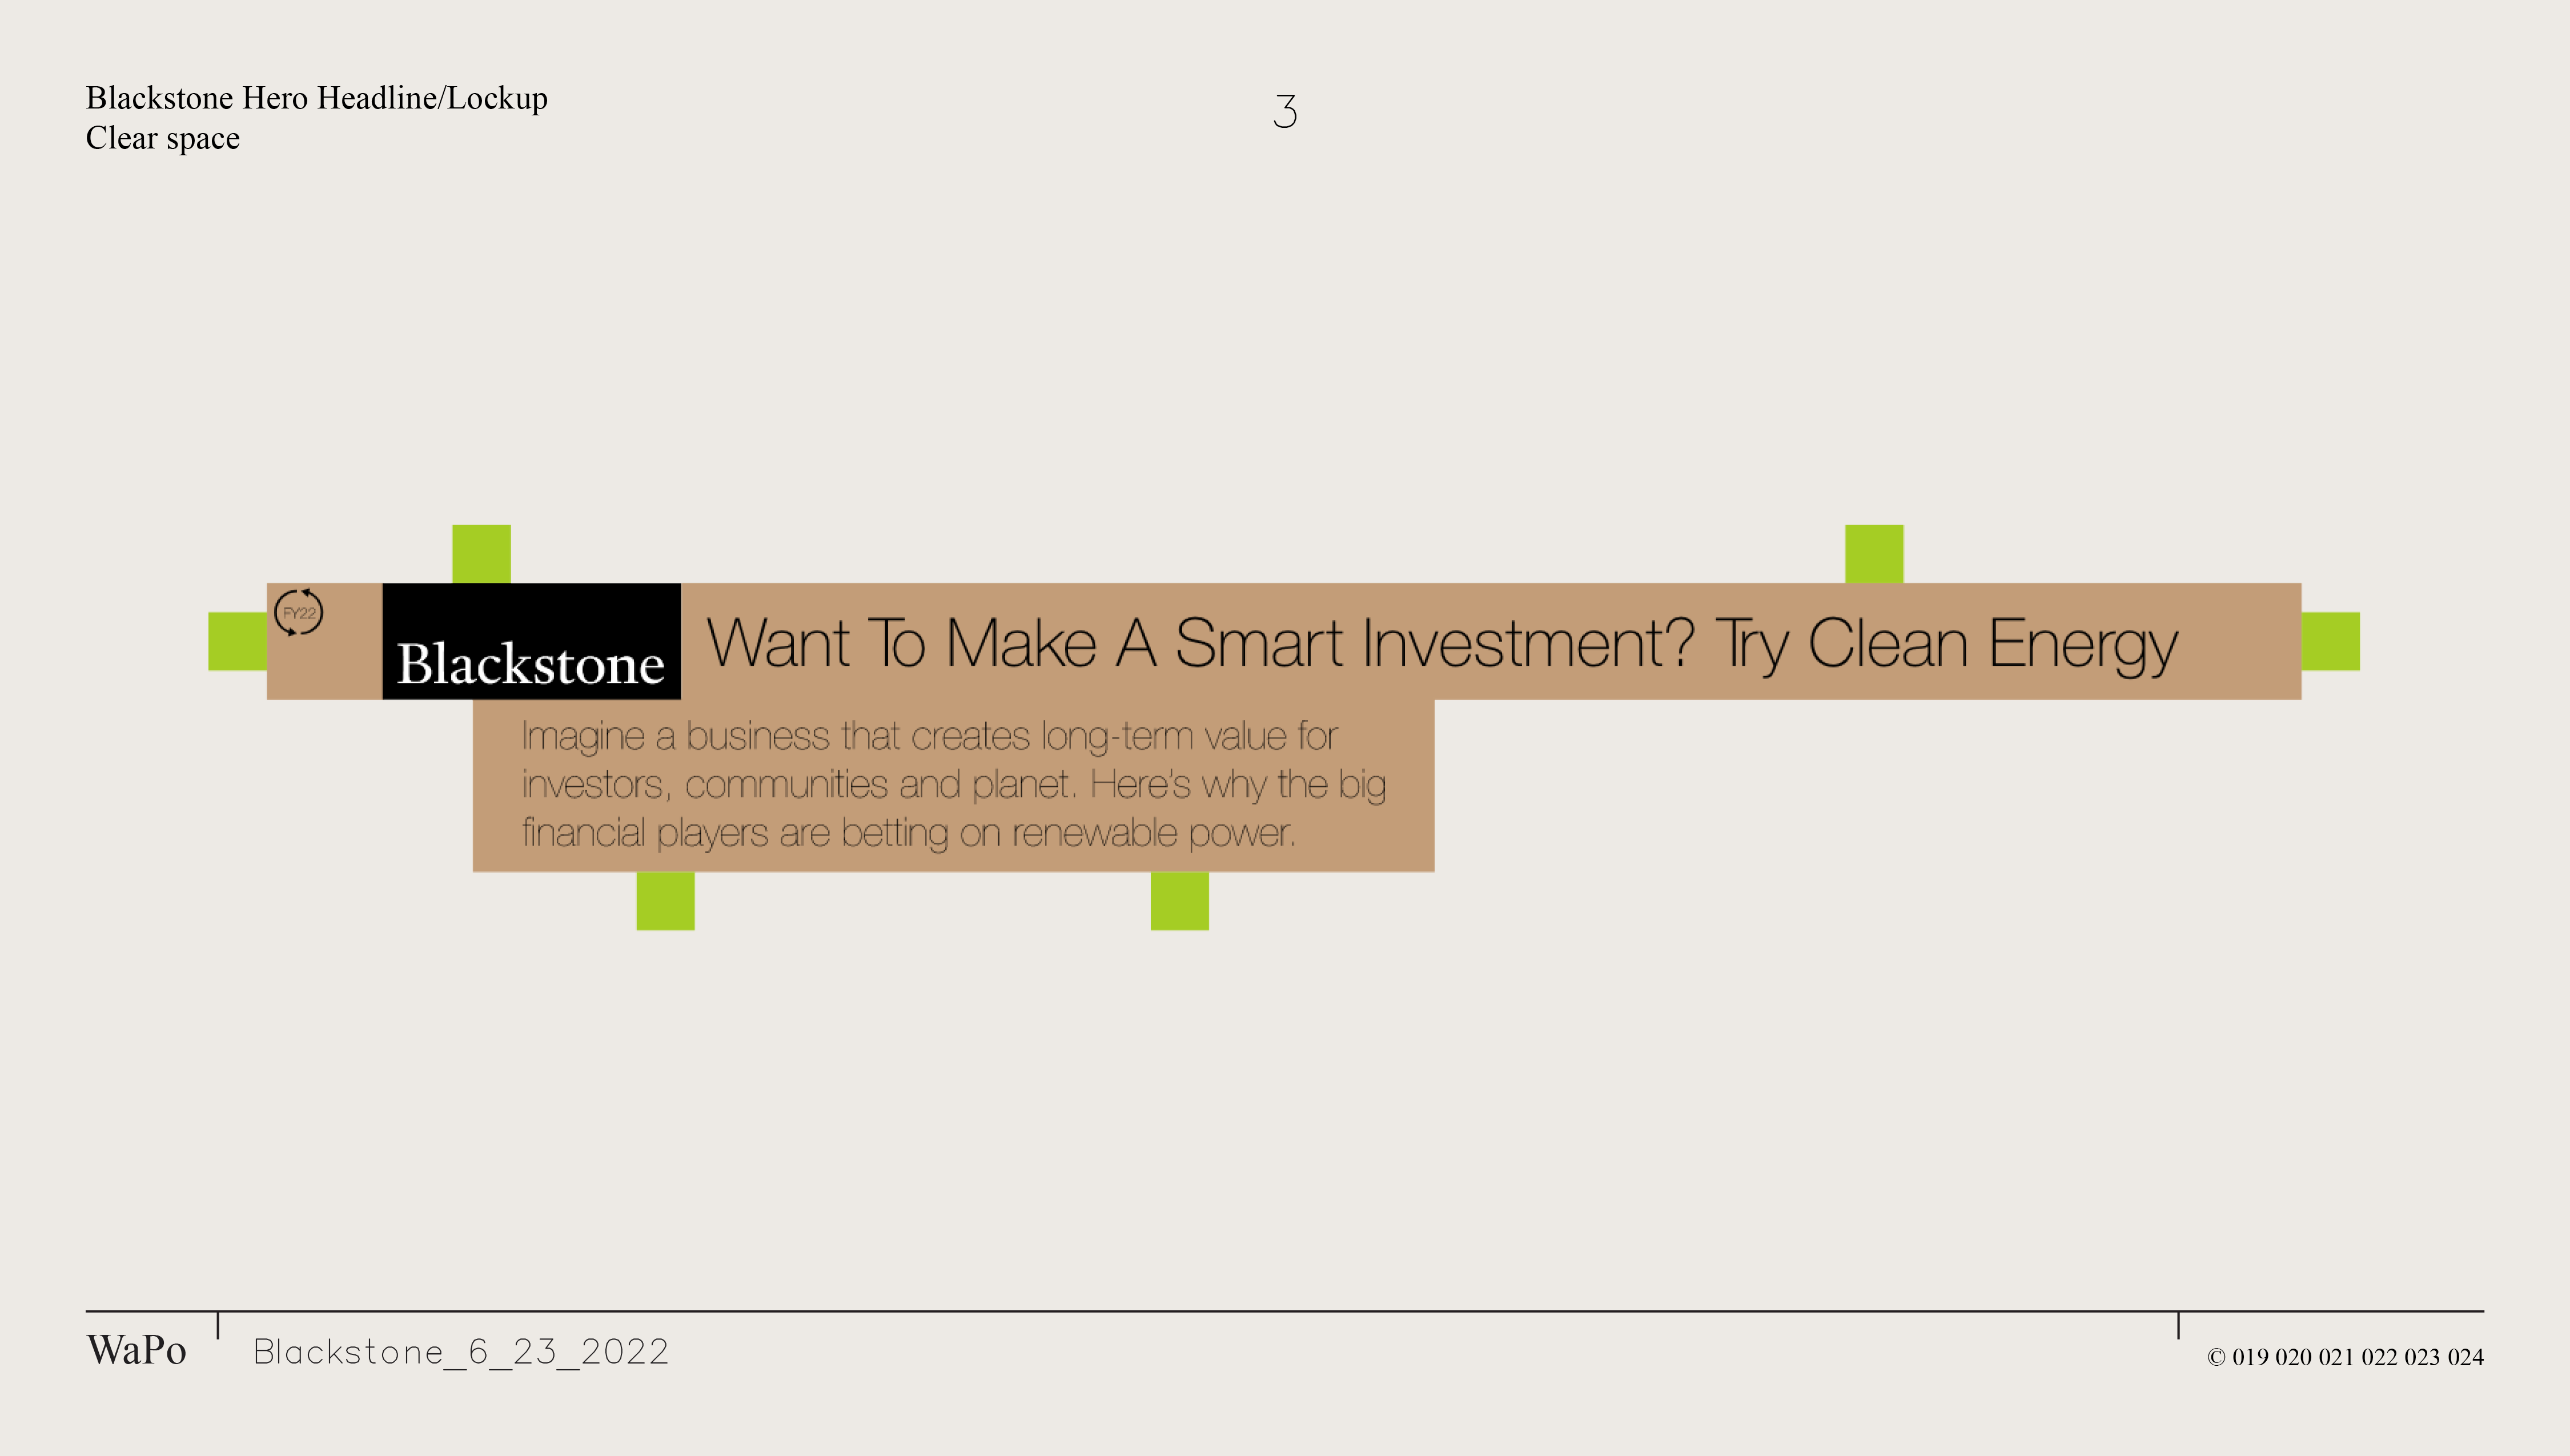
Blackstone
Washington Post
Role -Digital Designer
Role -Digital Designer
Write-Up
“The global investment firm [Blackstone] has taken the view that increasingly sustainability and decarbonizing makes its assets stronger
and more resilient. With this in mind, Blackstone is leveraging the breadth and expertise of its vast network of portfolio companies to build partnerships
that overcome traditional barriers to clean energy development.”
-- Washington Post
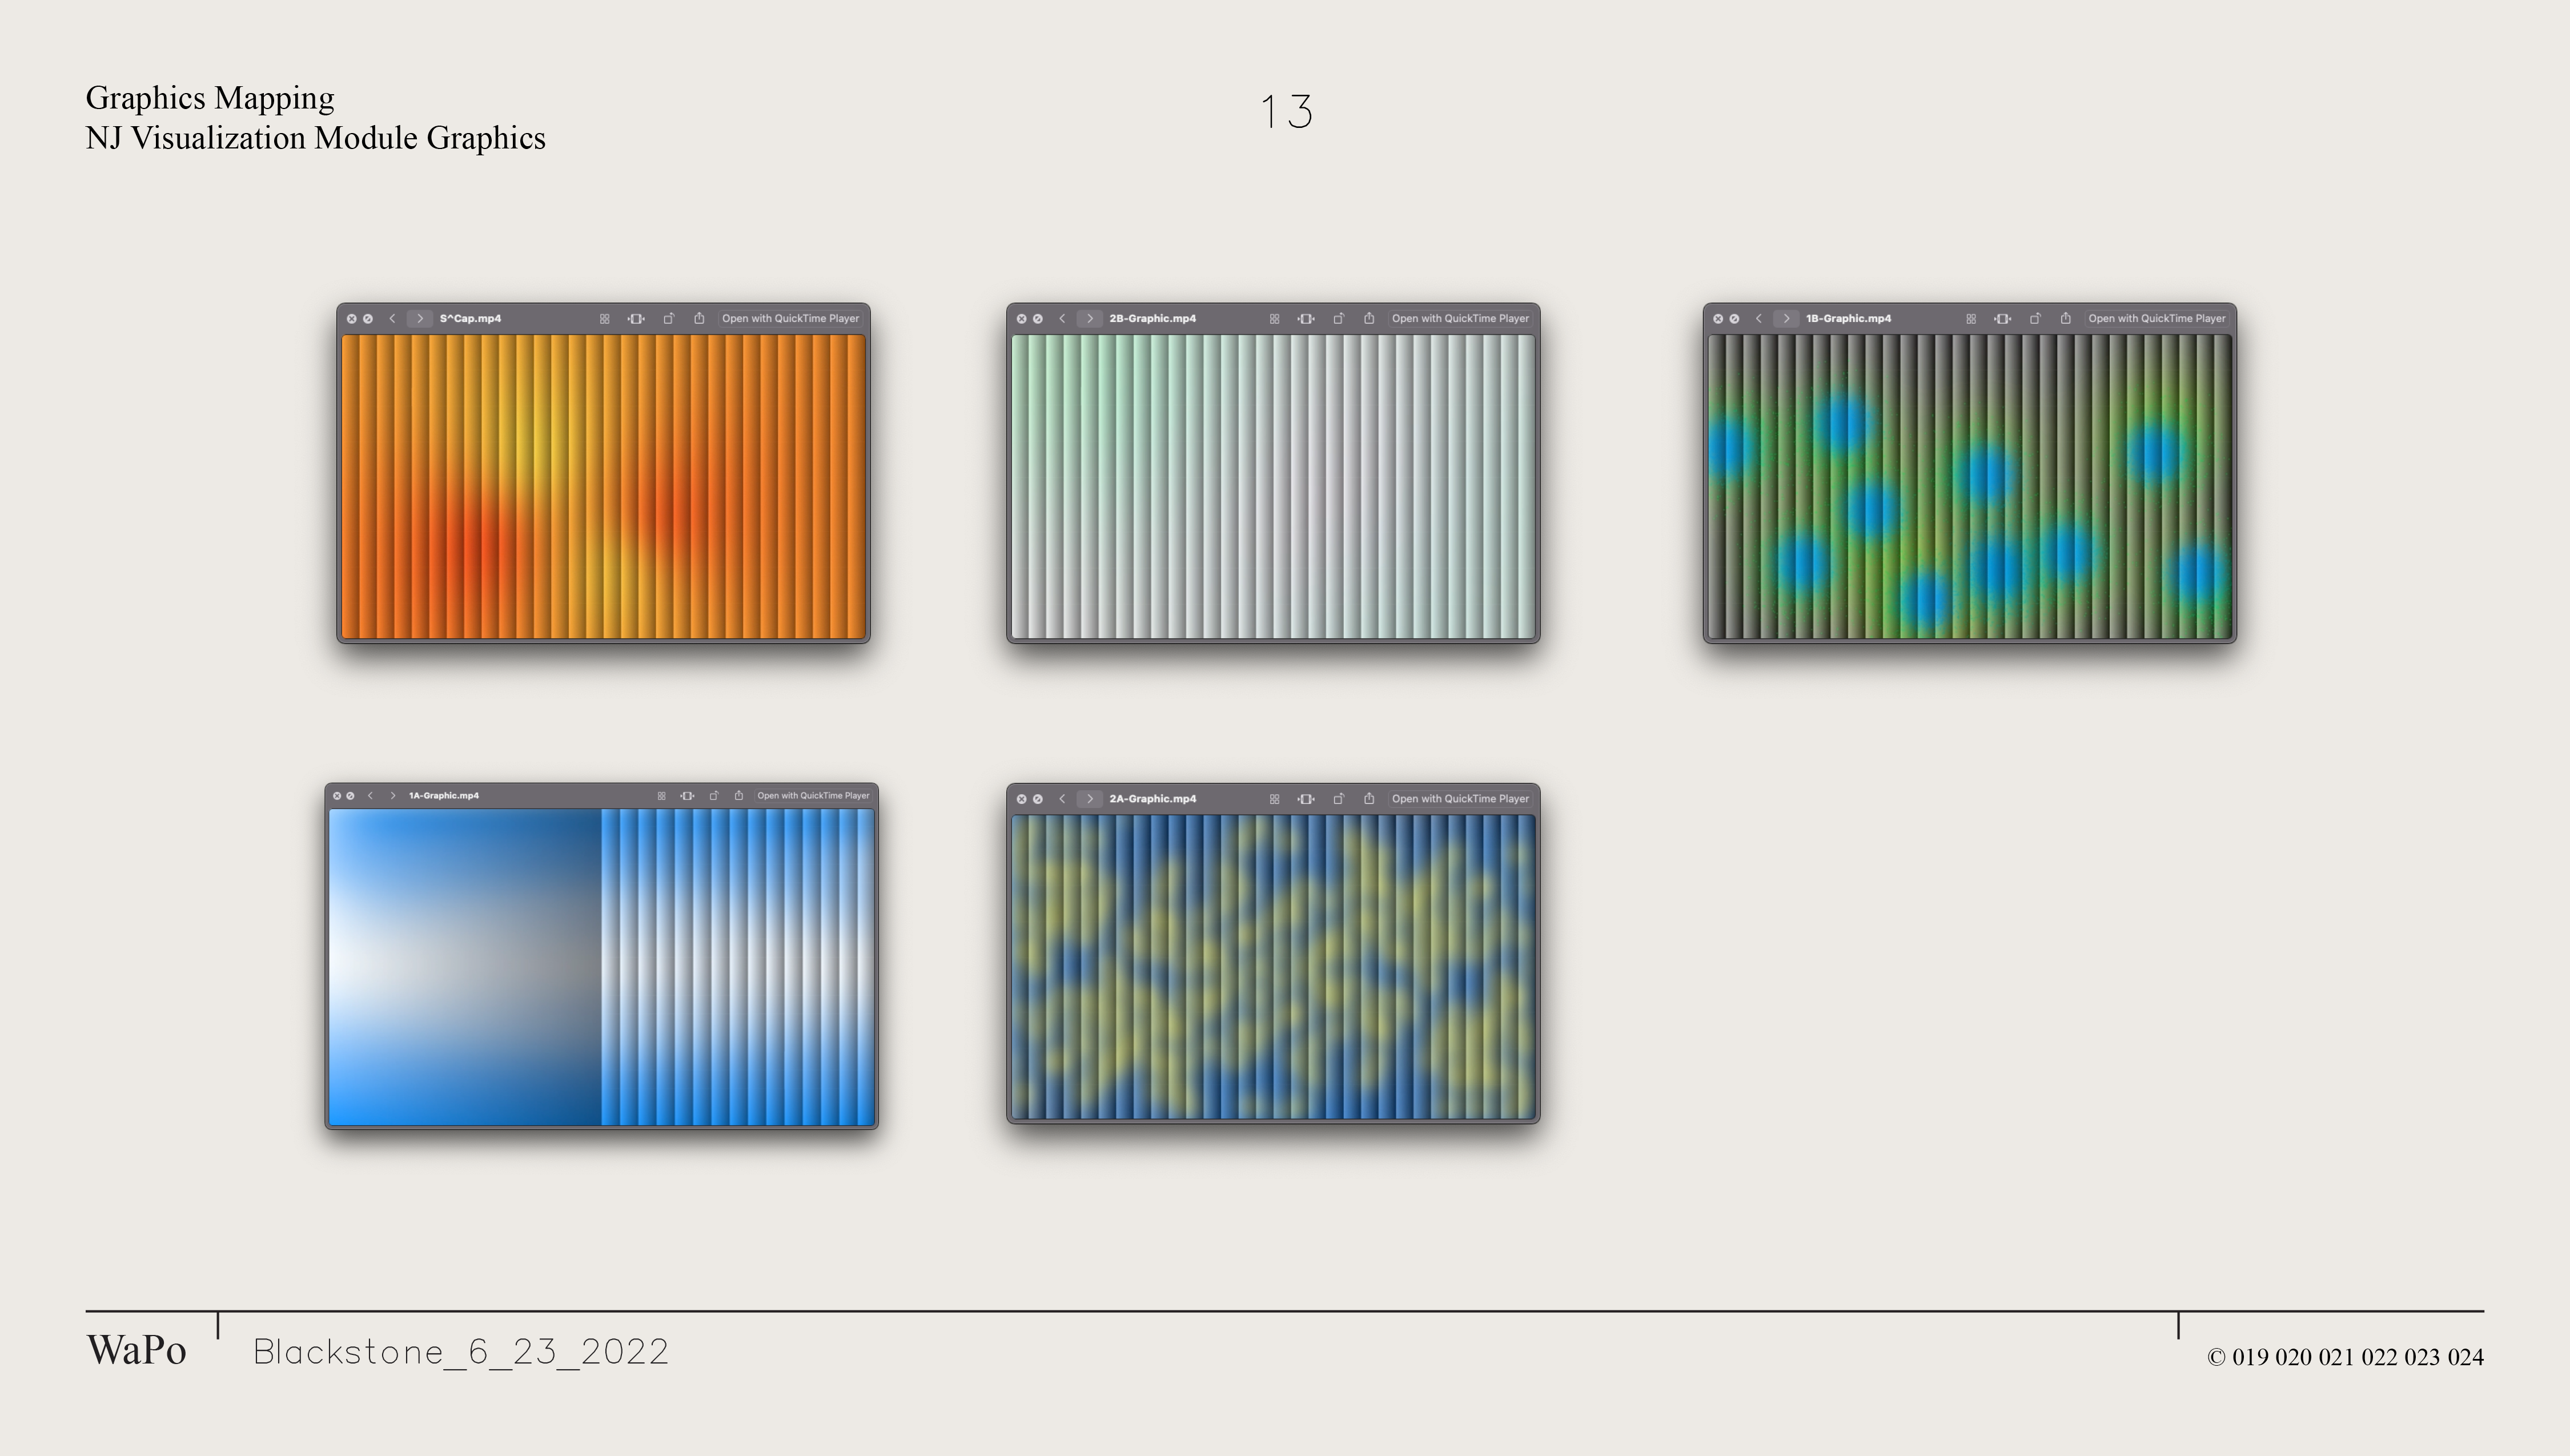
Blackstone came to the Washington Post with two sets of mood boards hinting at what the were looking for. The first referenced the work of Josef Müller-Brockmann. It was his classic, Swiss style paired with a selection of textured, gritty-feeling contemporary collage work. The second direction leaned more on contrasting stepped and tiled gradients alluding to the sun’s power. The collation of the those directions in tandem with some data vis work led us to our final output.
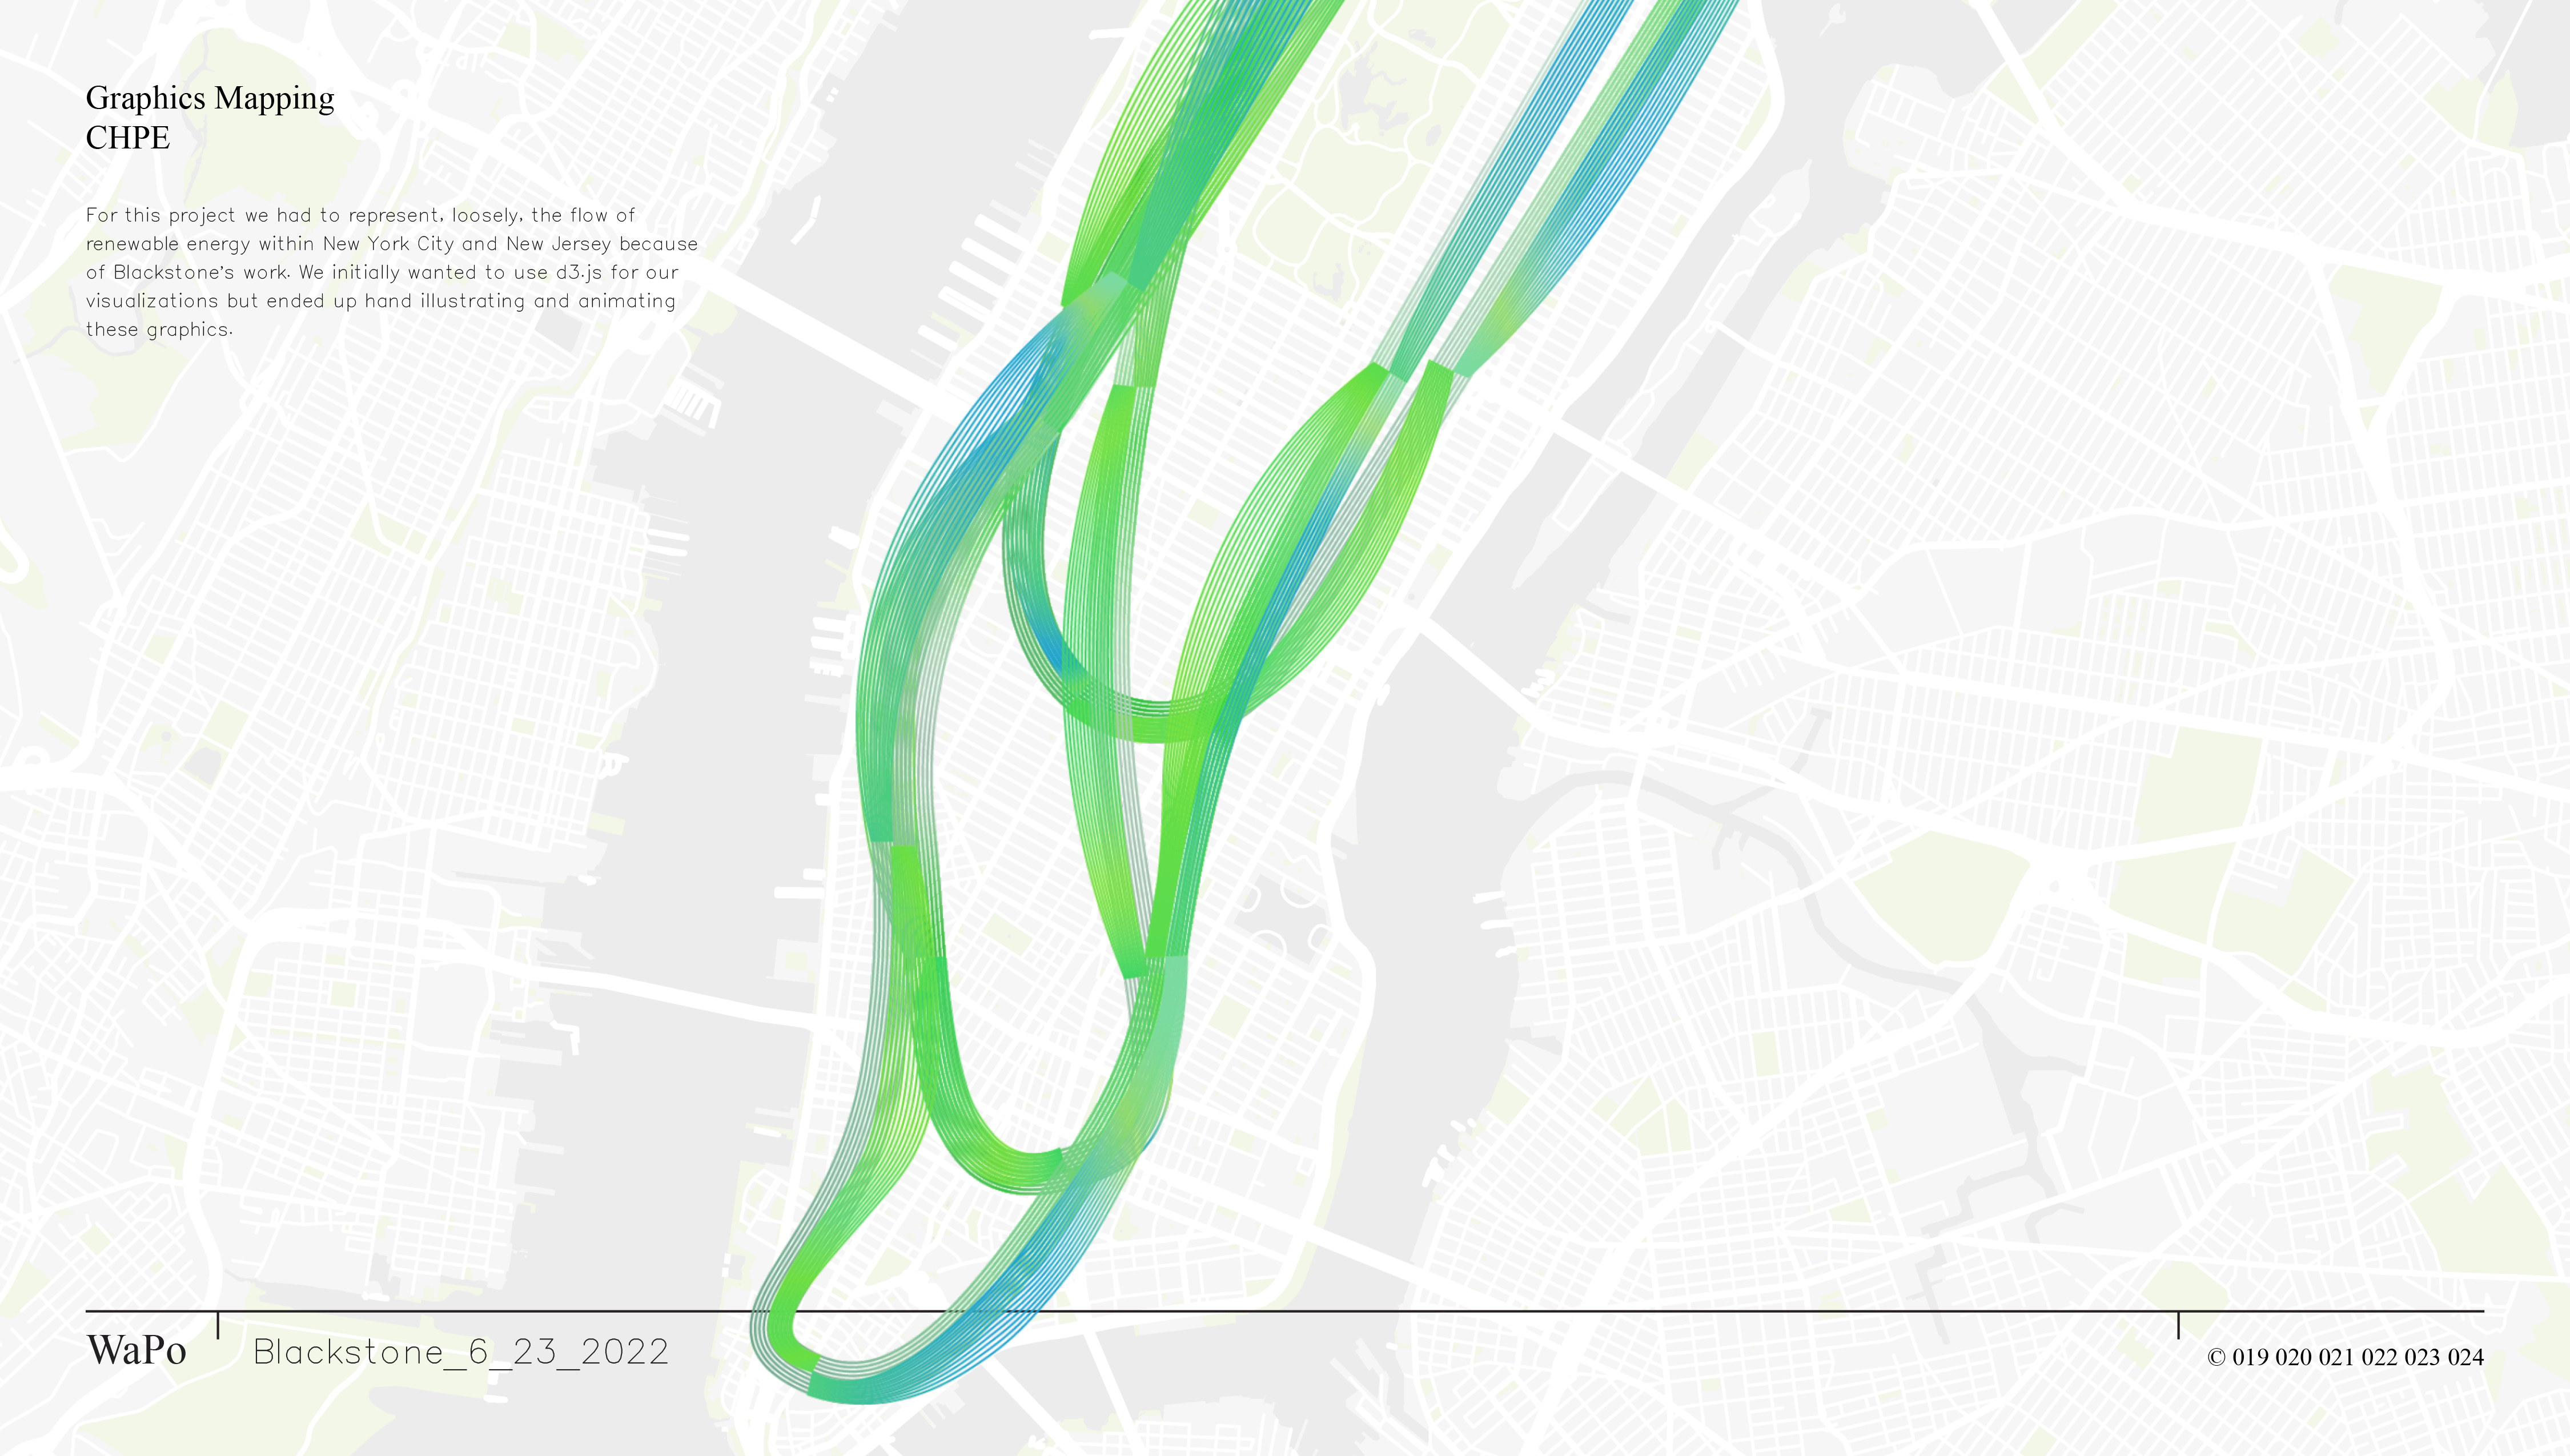
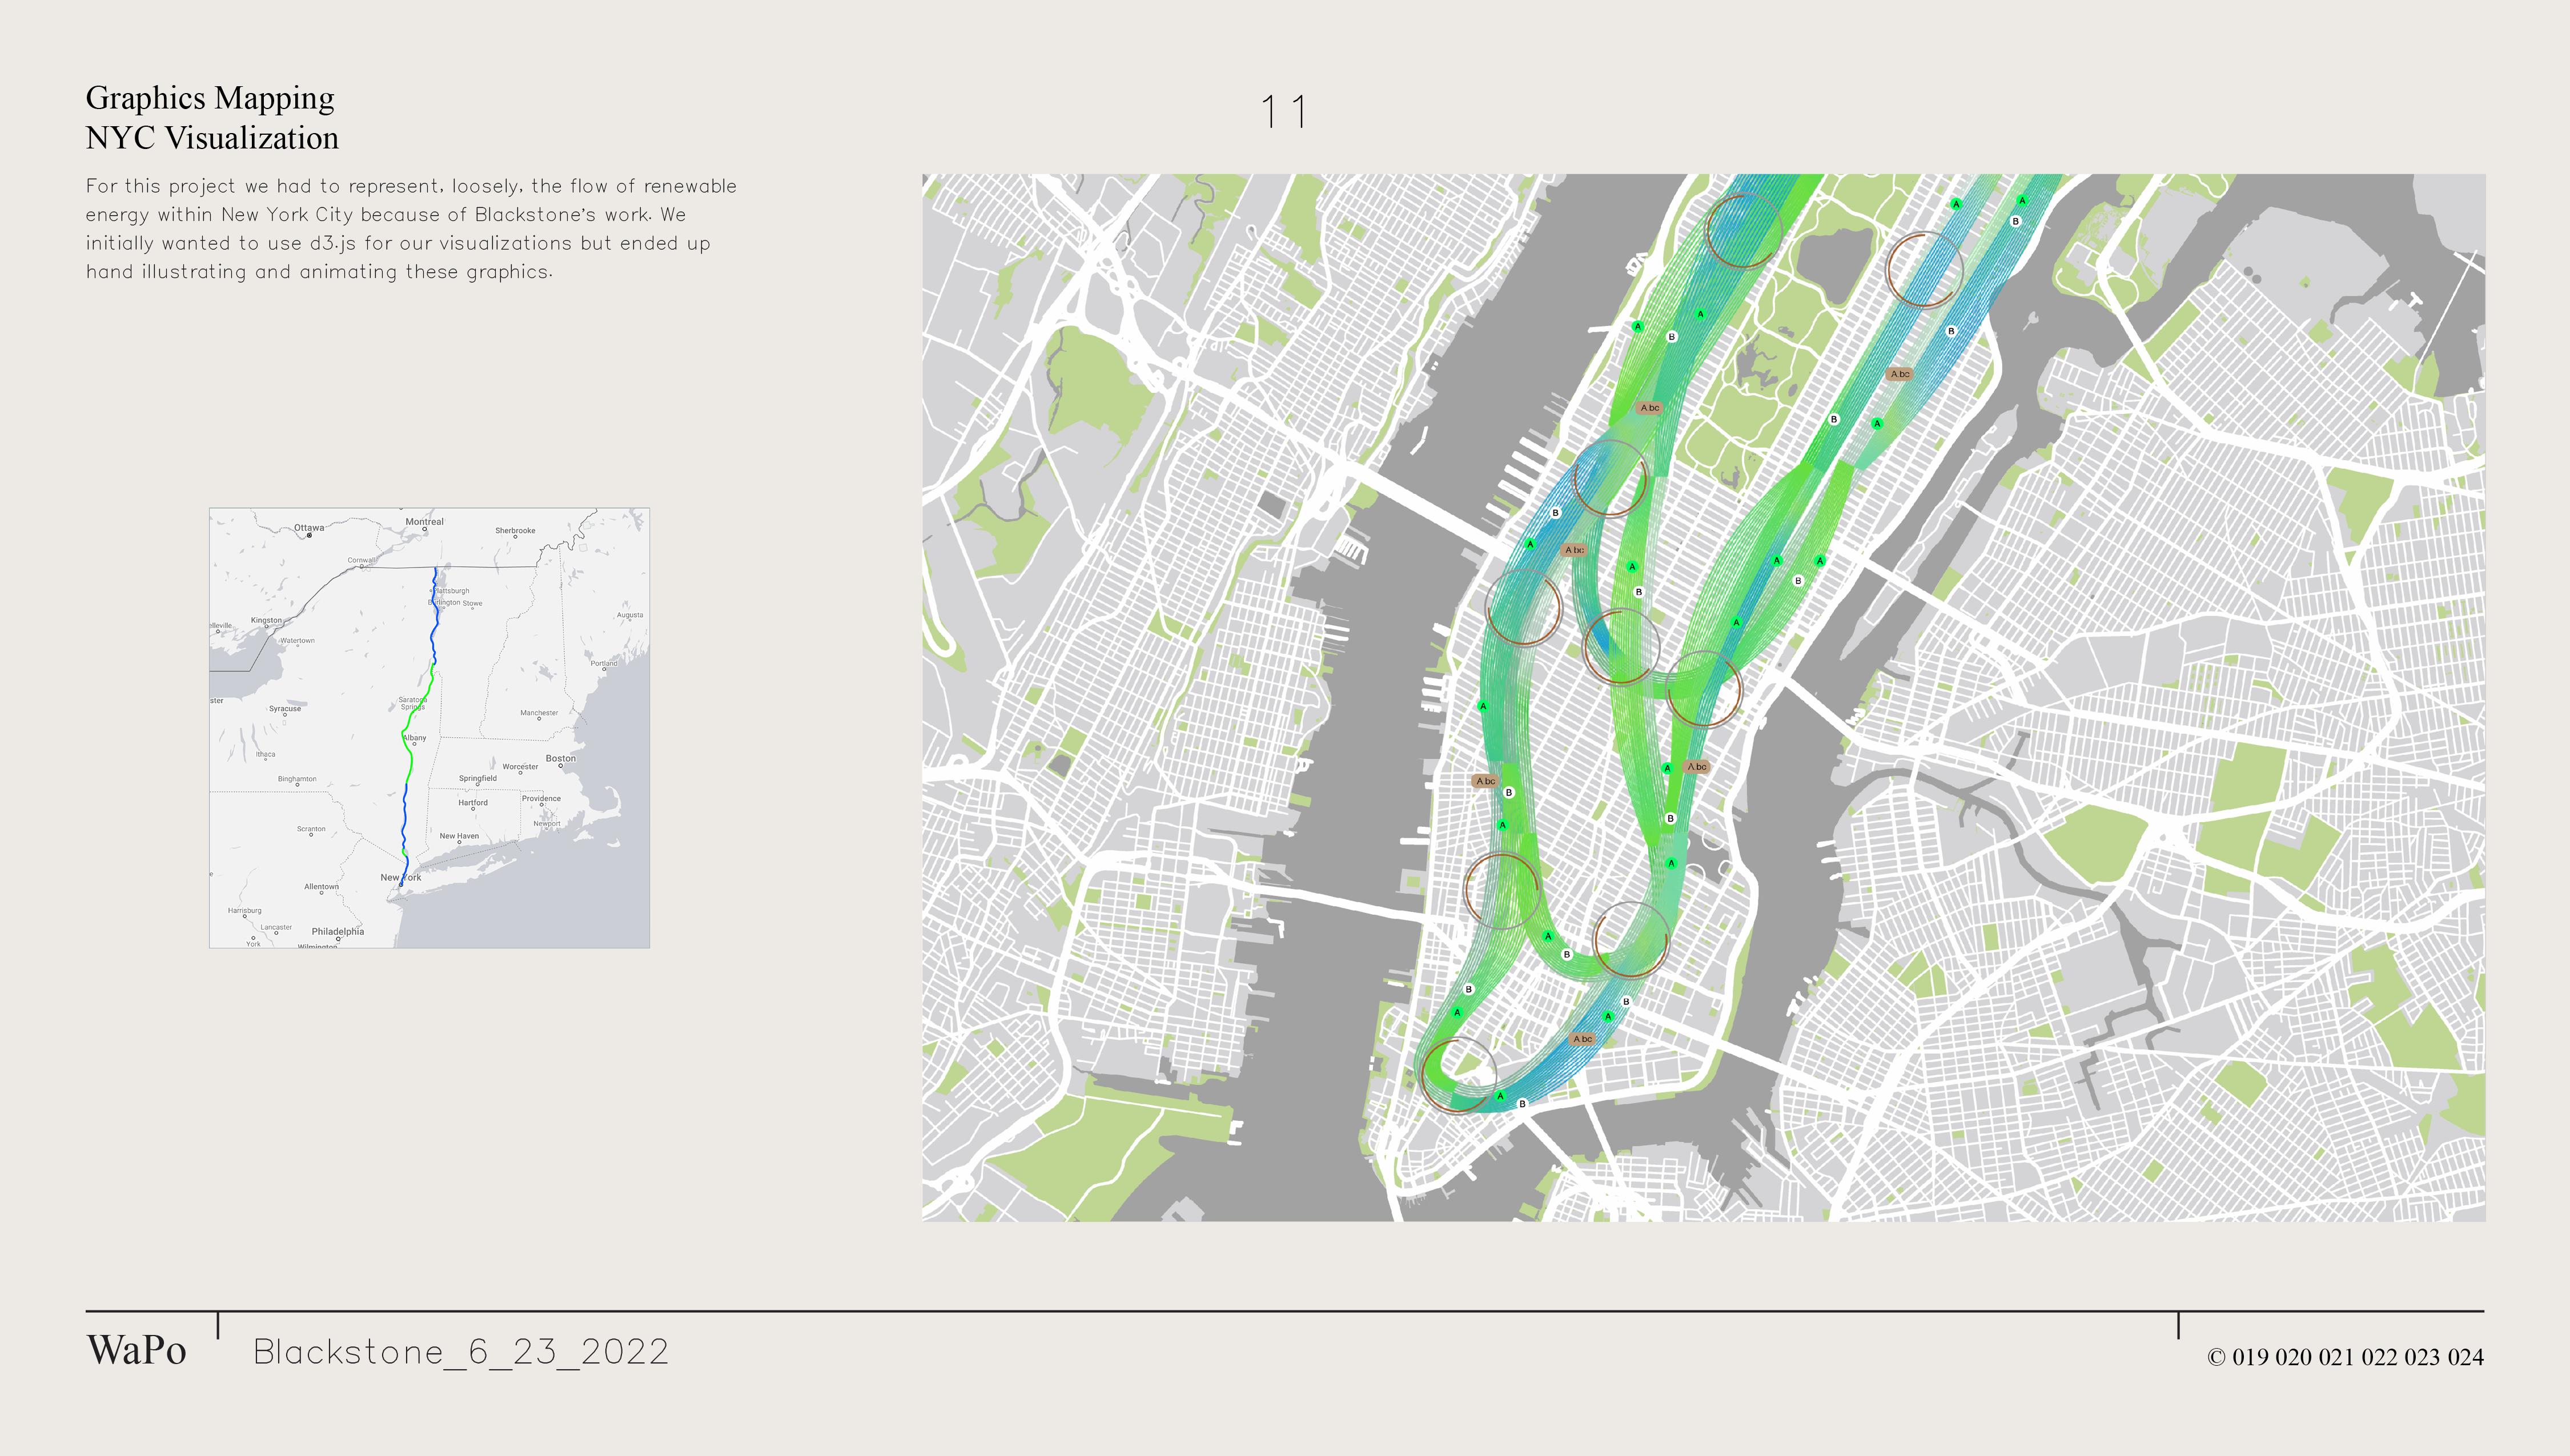
In this project we had to represent, loosely, the flow of renewable energy within New York City and New Jersey.
We initially wanted to use d3.js for our visualizations but ended up hand illustrating and animating these graphics.